Table of Contents
- What is HR analytics?
- How HR analytics differs from HR reporting
- Why HR analytics matters for Indian HR teams
- Key benefits of HR analytics
- Types of HR analytics (with simple examples)
- HR analytics process – step-by-step
- HR analytics tools and dashboards
- HR analytics examples and mini case studies (Indian context)
- Getting started: a checklist for Indian HR teams
- Conclusion: Turn HR data into decisions – not just reports
- Common questions about HR analytics (FAQ)
HR is no longer just about policies, payroll, and firefighting employee issues.
Today, when your CEO asks, “What is hr analytics and how can it help us cut attrition or hire better?”, you need more than gut feeling. You need numbers, patterns, and stories from your people data.
That is exactly where hr analytics comes in. In this guide, we’ll break down hr analytics meaning, types, tools, hr analytics dashboard basics, and real Indian examples so you can move from reactive HR to data-driven HR without needing a data science degree.
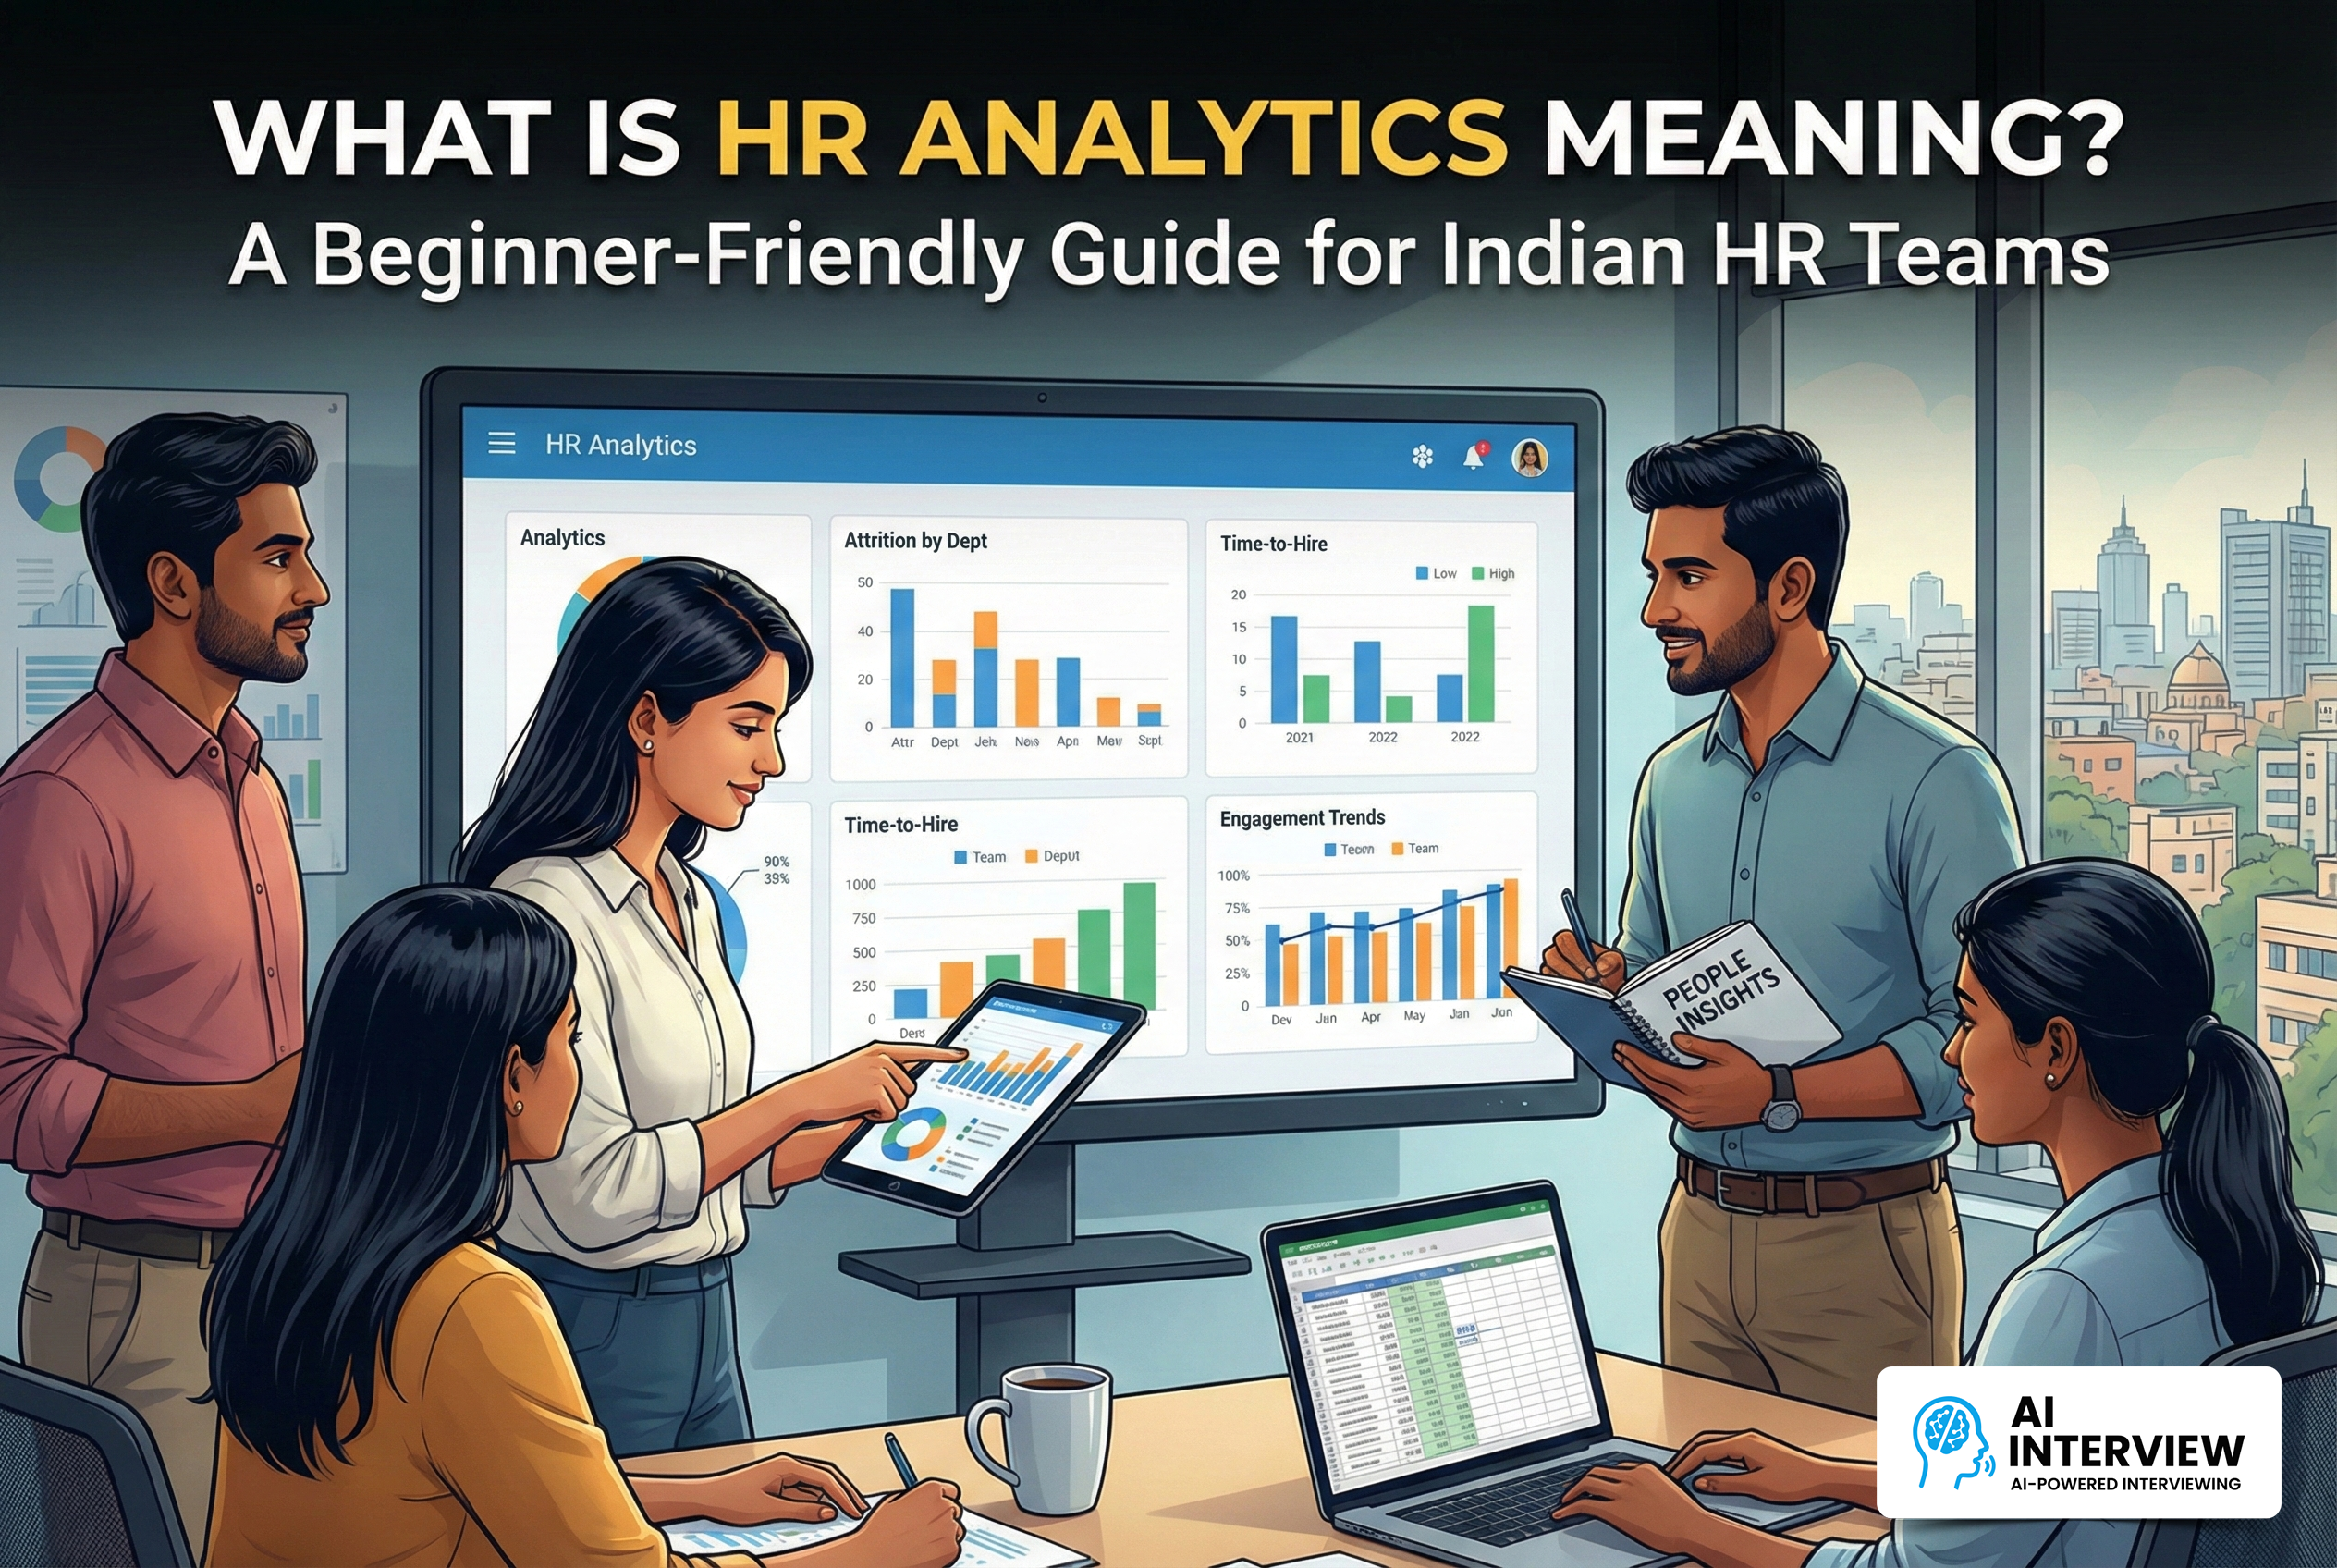
What is HR analytics?
In simple words, hr analytics (also called hr data analytics, people analytics, or workforce analytics) is the practice of using your HR data to answer important questions about people and performance – and then using those answers to make better decisions.
Instead of just recording data like:
- How many people joined or left
- How many offers were rejected
- How many people are on PIP
…you start asking questions like:
- Why are high performers leaving in one particular team?
- Which hiring channels actually bring us long-term, high-quality talent?
- What manager behaviours are linked with better engagement scores?
So hr analytics meaning is not just “more reports” – it is about turning raw HR data into insights and actions that improve hiring, retention, productivity, and culture.
How HR analytics differs from HR reporting
Many Indian HR teams already create monthly or quarterly HR reports. So what is the difference between HR reporting and hr and data analytics?
Think of it like this:
- HR reporting = What happened?
- Example: “Attrition last quarter was 24%.”
- Example: “Attrition last quarter was 24%.”
- HR analytics = Why did it happen, and what should we do next?
- Example: “Attrition is high among 0–18 month employees in Sales from one region, mainly due to low manager support and unrealistic targets. We should fix onboarding and manager coaching first.”
- Example: “Attrition is high among 0–18 month employees in Sales from one region, mainly due to low manager support and unrealistic targets. We should fix onboarding and manager coaching first.”
Reporting looks backward. HR analytics looks backward, understands why, and then looks forward with recommendations.
Why HR analytics matters for Indian HR teams
For Indian companies – whether you’re a 100-person startup in Bengaluru or a 10,000-employee enterprise in Mumbai – people costs are one of your biggest investments.
At the same time, most HR teams are expected to “do more with less”:
- Faster hiring with limited recruiters
- Better engagement with tight budgets
- Lower attrition in competitive markets
The importance of hr analytics is that it helps you move from guesswork to evidence. Instead of arguing based on opinions, you can sit at the table with:
- Clear metrics
- Visual trends
- Data-backed recommendations
And earn more trust from leadership.
Key benefits of HR analytics
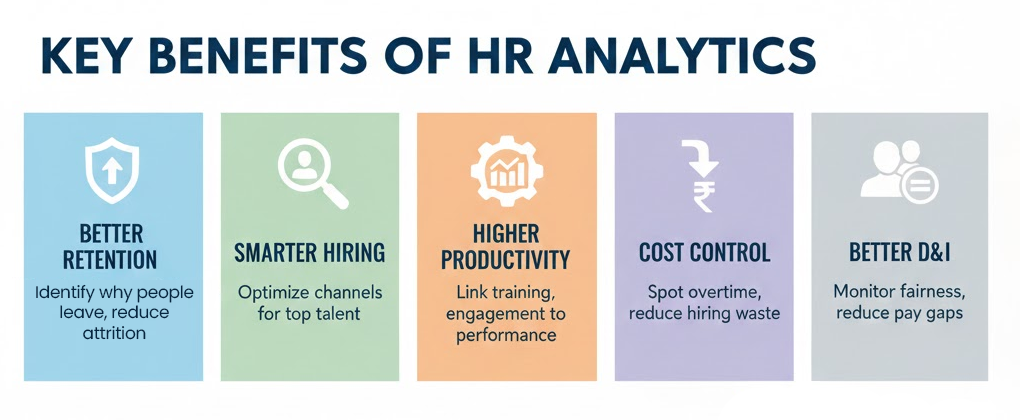
Some practical benefits of hr analytics for Indian HR teams:
- Better retention: Identify where attrition is highest, why people leave, and what interventions work.
- Smarter hiring: Track which job boards, campuses, or referral programs bring the best long-term hires.
- Higher productivity: Link engagement, training, and manager behaviour with performance outcomes.
- Cost control: Spot overtime leakages, overstaffed roles, or costly hiring channels early.
- Better diversity and inclusion: Monitor gender representation, promotion fairness, and pay gaps with real data.
Overall, the benefits of hr analytics show up as fewer surprises, fewer escalations, and more confidence in HR decisions.
Tangible business outcomes: examples
- IT services company in Pune
Problem: High attrition among mid-level engineers in one BU, hurting project delivery.
Analytics used:
- Exit reasons segmented by BU and tenure
- Engagement survey by manager
- Internal mobility data
Insight: People were leaving not only for salary, but also because they saw no internal growth path. Managers were not proactively discussing careers.
Result (example): After launching an internal job posting program and manager coaching, attrition in that BU dropped over the next two quarters.
- Manufacturing company in Gujarat
Problem: Absenteeism and overtime costs were rising in the plant.
Analytics used:
- Attendance vs shift pattern
- Overtime hours vs output
- Supervisor-wise data
Insight: One shift pattern and one supervisor’s team were responsible for a large share of unscheduled absenteeism.
Result (example): After reworking the roster and coaching the supervisor, overtime costs stabilised and absenteeism reduced.
- Fast-growing startup in Bengaluru
Problem: Interview-to-offer ratio was high, but offer-to-join ratio was poor.
Analytics used:
- Funnel data from ATS (applications → interviews → offers → joining)
- Candidate feedback data
Insight: The interview process was long, and communication post-offer was weak compared to competitors.
Result (example): After simplifying interview rounds and improving candidate communication, joiner rates improved.
These are realistic hr analytics examples that show how a bit of analysis can unlock very practical fixes.
Types of HR analytics (with simple examples)
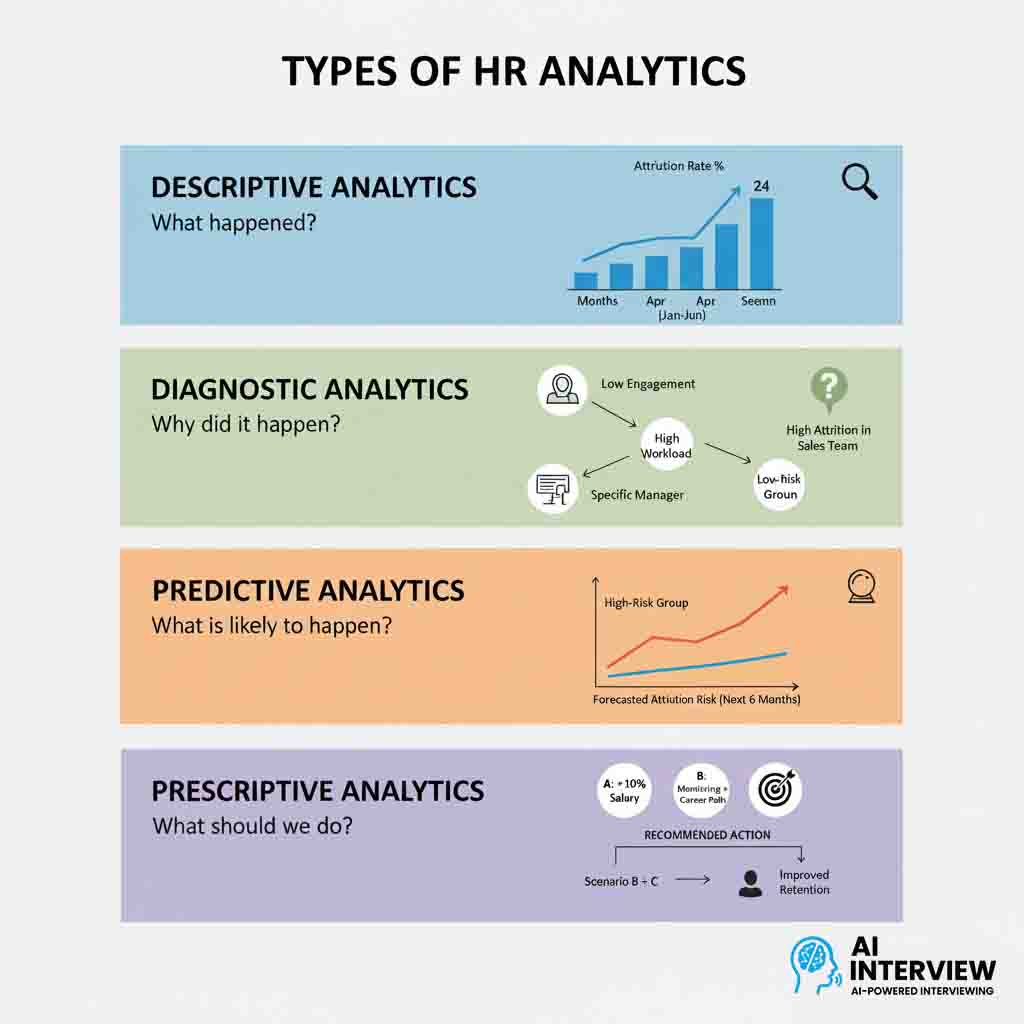
HR analytics is usually described in four levels: descriptive, diagnostic, predictive, and prescriptive.
Descriptive HR analytics (What happened?)
This is your basic “what happened” view using HR metrics.
Example (India):
You look at a dashboard showing:
- Monthly headcount
- Attrition rate
- Average time-to-hire
- Training hours per employee
You identify that attrition spiked in Q2 among customer support staff.
Diagnostic HR analytics (Why did it happen?)
Here, you dig into the reasons.
Example:
You combine exit interviews, salary bands, engagement survey results, and manager-wise data. You discover:
- Pay is slightly below market
- But the bigger driver is workload and poor shift planning under two specific managers
Now you know the “why”, not just the “what”.
Predictive HR analytics (What is likely to happen?)
This level uses patterns to forecast future outcomes.
Example:
Using historical data, you find that employees:
- Who had low engagement scores
- Got no internal moves or training in 12 months
- And worked under certain managers
…are much more likely to leave in the next 3–6 months.
Now you can flag “high-risk of attrition” groups early and act.
Prescriptive HR analytics (What should we do?)
Here, analytics recommends actions.
Example:
You simulate different scenarios:
- Scenario A: Increase salary by 10%
- Scenario B: Introduce career paths + mentoring
- Scenario C: Reduce workload and redraw targets
Based on past data, you see that a mix of Scenario B and C is more effective than pure salary hikes.
Even simple prescriptive analysis – not necessarily advanced AI – can help HR leaders choose better interventions.
HR analytics process – step-by-step
You don’t need to start with fancy AI models. A basic hr analytics process is enough to begin.
Most Indian HR teams can follow these steps:
- Define the business question: Example: “How can we reduce early attrition in sales?”
- Identify data sources: HRIS, ATS, payroll, engagement survey, exit forms, etc.
- Clean and combine the data: Remove duplicates, fix missing values, align employee IDs.
- Analyze and visualize: Use Excel, BI tools, or an hr analytics dashboard to see patterns.
- Interpret and recommend: Translate insights into simple actions for business leaders.
- Execute and track impact: Implement actions, then revisit the same metrics after 3–6 months.
Typical data sources for HR analytics
Common data sources for hr data analytics include:
- HRIS / HRMS: Employee profiles, join dates, transfers, promotions, performance ratings
- ATS (Applicant Tracking System): Source of hire, interview stages, offer data, rejection reasons
- Payroll and attendance: Salary, overtime, leave, absenteeism
- Engagement and pulse surveys: Satisfaction, manager feedback, culture scores
- Learning systems: Training enrolment, completion, learning hours
Even if your tools are basic or partly manual, you can start combining this data at a small scale.
Common pitfalls – and how to avoid them
Some traps Indian HR teams often fall into:
- Starting with tools, not questions
- Don’t begin with “Which hr analytics tools should we buy?”. Start with “What problems are we solving?”.
- Don’t begin with “Which hr analytics tools should we buy?”. Start with “What problems are we solving?”.
- Poor data quality
- Incomplete employee IDs, inconsistent reason codes, outdated records – all will ruin your analysis. Clean first, analyse later.
- Incomplete employee IDs, inconsistent reason codes, outdated records – all will ruin your analysis. Clean first, analyse later.
- Doing analytics in a silo
- Partner with Finance, Business, and IT. HR and data analytics work best when cross-functional.
- Partner with Finance, Business, and IT. HR and data analytics work best when cross-functional.
- Overcomplicating too early
- You don’t need predictive models on day one. Basic descriptive and diagnostic HR analytics can already deliver strong value.
- You don’t need predictive models on day one. Basic descriptive and diagnostic HR analytics can already deliver strong value.
HR analytics tools and dashboards
You can do basic hr analytics in Excel or Google Sheets.
But as your company grows, you’ll likely need hr analytics tools and a proper hr analytics dashboard to scale your work and share insights easily.
What to expect from an hr analytics dashboard
A good hr analytics dashboard should help you:
- See key HR metrics at a glance: Headcount, new hires, exits, attrition, time-to-hire, absenteeism
- Slice and dice data: By location, department, manager, gender, tenure, grade
- Track trends over time: Month-on-month or quarter-on-quarter shifts
- Export or present visuals: Charts for leadership reviews without creating PPTs every time
For example, a workforce analytics or people analytics dashboard could show:
- Attrition trend vs engagement trend
- Offer acceptance rate by source
- Internal mobility vs retention
This makes your hr data analytics easier to “sell” to business leaders who think visually.
Popular tool categories and examples
You don’t have to name a specific vendor in your pitch, but it helps to know the broad categories of hr analytics tools:
- Built-in HRMS analytics
- Many Indian HRMS / HRIS providers now come with basic dashboards (headcount, attrition, attendance).
- Many Indian HRMS / HRIS providers now come with basic dashboards (headcount, attrition, attendance).
- Business intelligence (BI) tools
- Tools like Power BI, Tableau, or Looker can connect to HR data sources to create custom dashboards.
- Tools like Power BI, Tableau, or Looker can connect to HR data sources to create custom dashboards.
- Specialized people analytics platforms
- Tools focused specifically on people analytics, engagement, and HR KPIs.
- Tools focused specifically on people analytics, engagement, and HR KPIs.
- Point solutions (for hiring, engagement, performance)
- ATS, engagement platforms, and AI-based interview tools (like AIInterview.in) often include analytics around hiring funnel, candidate performance, or assessment scores.
- ATS, engagement platforms, and AI-based interview tools (like AIInterview.in) often include analytics around hiring funnel, candidate performance, or assessment scores.
When evaluating tools, remember: the goal is not “cool charts”. The goal is faster, better people decisions.
How to evaluate HR analytics tools
Use a simple checklist:
- Data connectors
- Does it connect easily with your HRMS, ATS, payroll, and engagement tools?
- Does it connect easily with your HRMS, ATS, payroll, and engagement tools?
- Ease of use
- Can HR business partners and managers use it without needing IT daily?
- Can HR business partners and managers use it without needing IT daily?
- Governance and security
- Role-based access, Indian data residency options, audit trails, compliance.
- Role-based access, Indian data residency options, audit trails, compliance.
- Scalability
- Can it handle growing data volume and new entities/locations?
- Can it handle growing data volume and new entities/locations?
- ROI
- Will it save manual reporting hours, reduce attrition, speed up hiring, or support better performance decisions?
- Will it save manual reporting hours, reduce attrition, speed up hiring, or support better performance decisions?
If you’re not ready for a big system, start with Excel-based templates, then gradually move towards more advanced tools as your hr analytics maturity grows.
HR analytics examples and mini case studies (Indian context)
Let’s look at some short, realistic hr analytics examples in an Indian setting.
Case study 1: Reducing early attrition in a BPO
Problem:
A Chennai-based BPO saw 40% of new hires leave within six months.
Analytics used:
- Join/exit dates from HRIS
- Exit reasons
- Training completion data
- Supervisor-wise performance data
Insights:
- Early leavers had lower training completion rates.
- Attrition was highest under two supervisors with poor engagement scores.
- Night shifts with unpredictable weekly offs had higher resignations.
Action:
- Redesigned training with more practice time.
- Rotated supervisors, gave them coaching.
- Introduced fixed weekly offs for certain high-stress shifts.
Result (example):
Over two quarters, early attrition reduced, and average training scores improved.
Case study 2: Improving offer-to-join ratio in a tech startup
Problem:
A Bengaluru SaaS startup struggled with candidates dropping off after offer.
Analytics used:
- ATS data (offers rolled out vs joined)
- Source of hire
- Time taken from final interview to offer
- Candidate feedback survey
Insights:
- Delay between final round and offer letter was too long.
- Candidates from one hiring partner had especially poor join rates.
- Many candidates accepted competitor offers with clearer growth paths.
Action:
- Committed to rolling out offers within 48 hours for high-priority roles.
- Switched focus to referral and direct sourcing channels.
- Added a “career path” section to offer discussions.
Result (example):
Offer-to-join ratio improved, and recruiters were able to close roles faster.
Case study 3: Linking training to performance in a mid-sized bank
Problem:
A regional bank was unsure if its leadership training was really working.
Analytics used:
- Training completion data
- Performance ratings of managers and their teams
- Engagement survey scores
Insights:
- Managers who completed a specific leadership module had teams with better engagement and slightly higher performance ratings.
- However, completion rates were low due to scheduling issues.
Action:
- Made leadership modules part of performance goals.
- Offered micro-learning and blended formats to improve completion.
Result (example):
Training completion rates went up, and the bank had stronger evidence to defend the L&D budget.
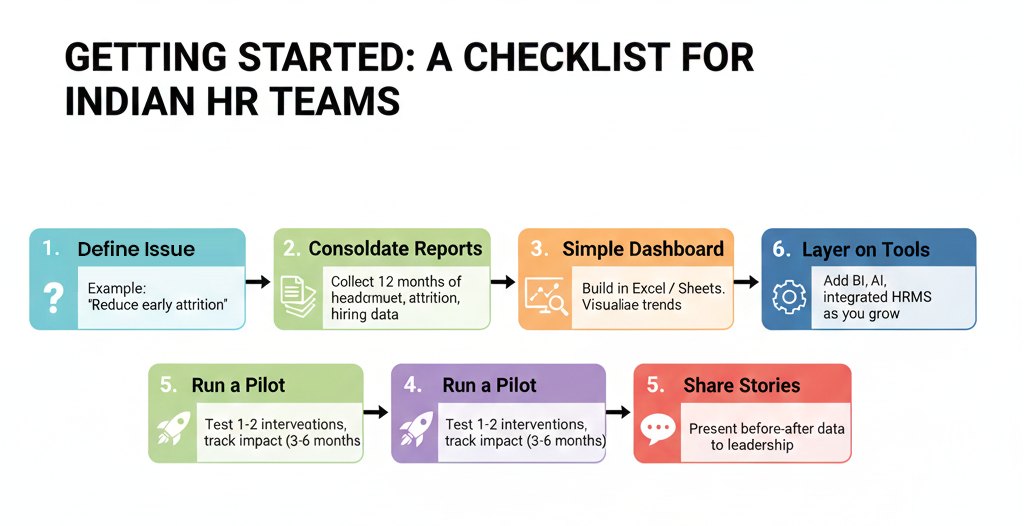
Getting started: a checklist for Indian HR teams
You don’t have to transform into a data scientist. You just need to be a little more intentional about how you use data.
Low-cost starting points
- Start with one business problem: Example: “Reduce early attrition” or “Improve offer-to-join ratio”.
- Consolidate basic reports: Collect 12 months of data on headcount, attrition, hiring, engagement for that problem.
- Build a simple hr analytics dashboard in Excel or Google Sheets: Visualise trends and segment by department/manager/location.
- Run a pilot: Test one or two interventions and track impact over 3–6 months.
- Share stories: Present before-after data in your leadership and townhall meetings.
As you grow, you can layer on better tools, AI-based assessments, and more advanced people analytics.
For more hiring and talent insights, you can explore the AI Interview blogs.
KPIs to measure first
Start with a small, focused KPI set:
- Attrition rate (overall and early tenure)
- Offer-to-join ratio
- Time-to-hire for critical roles
- Internal mobility rate
- Engagement score by team or manager
As your hr analytics process matures, you can add more advanced HR metrics.
Conclusion: Turn HR data into decisions – not just reports
HR analytics is not about complicated formulas or expensive tools.
It is about being a little more curious with your HR data, asking better questions, and using insights to drive real change – in hiring, performance, retention, and culture.
If you want to move from “HR as support function” to “HR as strategic partner”, learning what is hr analytics and applying it in your context is a powerful first step.
Ready to see how AI-driven assessments and hr analytics can improve your hiring decisions?
- Book a demo with AIInterview.in (AI Interview Tool) and see how our platform helps you screen, assess, and shortlist candidates with data-backed insights.
- Prefer to explore first? Download a simple HR analytics checklist and use it with your own data.
- Or just reach out to our team for a quick consultation on where hr data analytics can create the fastest impact in your organization.
Common questions about HR analytics (FAQ)
What is hr analytics in simple terms?
HR analytics is the practice of using HR data (like hiring, performance, engagement, attrition) to answer questions and make better people decisions. It goes beyond basic reporting to explain why things happen and what you should do next.
Why is hr analytics important for Indian companies?
The importance of hr analytics lies in its ability to connect people decisions with business outcomes – revenue, customer experience, compliance, and cost. For Indian companies in competitive talent markets, hr analytics helps reduce attrition, improve hiring quality, and build stronger leadership pipelines. HiBob+1
What are the main types of hr analytics?
The main types of hr analytics are:
- Descriptive (what happened)
- Diagnostic (why it happened)
- Predictive (what is likely to happen)
- Prescriptive (what we should do)
Most teams start with descriptive and diagnostic, then move towards predictive and prescriptive analytics as data quality and tools improve. AIHR+2ThoughtSpot+2
What is an hr analytics dashboard?
An hr analytics dashboard is a visual screen (in Excel, BI tools, or HR software) that pulls in HR metrics and shows them as charts and tables. It helps leaders quickly see trends in headcount, attrition, hiring, engagement, and more – without reading long reports. HiBob+1
Do I need advanced hr analytics tools to get started?
Not at all. You can begin with:
- Clear business questions
- Clean, basic HR data
- Simple Excel or Google Sheets dashboards
As your needs grow, you can explore hr analytics tools, people analytics platforms, AI-based interview systems, and integrated HRMS solutions.